Social BI has arrived

Table of contents
There is no cookie-cutter way to measure social.
The more we talk to our customers, the more we realize, while there are a few metrics many organizations report on in a similar manner, every B2B company has its own approach to quantifying success.
The moment you want to deepen your understanding of how social is influencing your pipeline, your reporting begins to rely on so many different factors (strategy, goals, KPIs, etc.). There are no two marketing teams that report in the exact same way.
As pioneers of B2B social marketing tech, we want to provide you with all the tools you need to execute your social media strategy and measure results. So here it comes – our most important product release of 2020 – Social BI.
Oktopost’s Social BI is a robust tool for creating and sharing custom analytics reports powered by your social data. It’s packed with amazing features that will forever change how you look at social analytics, so let’s get to it.
Dashboard builder
The definition of a BI platform is taking any type of business question and applying your data to find an answer. And that’s exactly what you can now do in Oktopost: easily build custom dashboards and reports to track and analyze metrics in a way that’s most meaningful to your team.
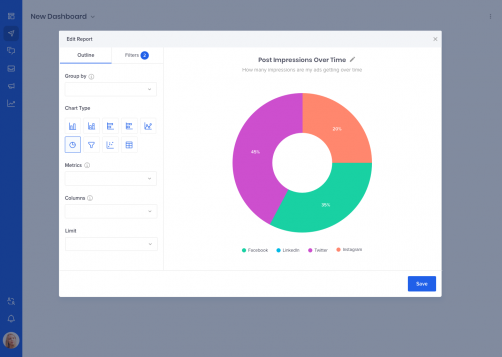
You can choose every possible parameter for your reports: data source, dimensions, metrics, chart type (we have quite a few beautiful visualization options there!), ordering, 20+ filters and more – to get a 360-degree view of, well, almost anything you want. And then drill down into your chart or table to get even more insights.
You can save your custom reports to dedicated dashboards and share them with your colleagues, either inside Oktopost or via exports. Finally, your dashboards can be made private (visible only to you) or public (all users in your account can see and edit them).
“Social BI is one of the biggest Oktopost features we’ve ever developed, and we are very proud of it. With this release, our B2B customers will be able to completely transform how they report and use social data as part of their business intelligence. To make that possible, we rebuilt the whole infrastructure for more flexibility and better performance,” Liad Guez, VP Product.
Pre-Made dashboards
If you’re not ready to build a custom dashboard yet or if you’re just dipping your toes into social reporting, Social BI comes with a set of pre-made dashboards.
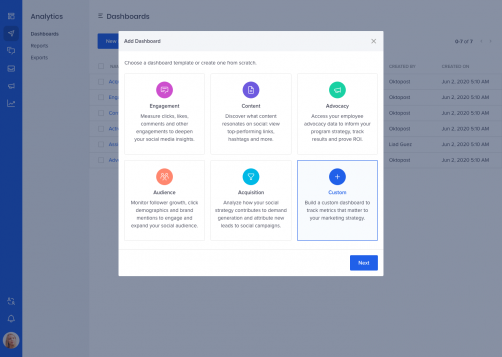
We built them according to what we know about B2B social reporting (spoiler: we know a lot). Here you will find best practice reports, from basic engagement breakdown charts to more complex acquisition funnels.
The best thing about our pre-made dashboards is that you can tweak them in any way you want: add, remove or edit reports, change dimensions and apply different filters. No wrong way to go about it.
“BI systems are complex by definition. But as much as we wanted to give our users flexibility and tools for customization, we also tried to make our Social BI intuitive and easy to use. We are guiding users through every step of report building with icons, tooltips, real-time previews and other components – to help them get the most out of our new feature,” Noya Bar Guy, Product Designer.
Recommended for further reading
Beautiful exportable reports
Presentation matters. So we’ve completely revisited our data exports for Social BI.
You can export reports and dashboards as beautiful, ready-to-share PDF, CSV, PowerPoint and Excel files. Download them, send as an email or export via your preferred method.
There is a recurring export option as well. No more confusing spreadsheets and manual data entry every month, Oktopost takes all the hard work from reporting.
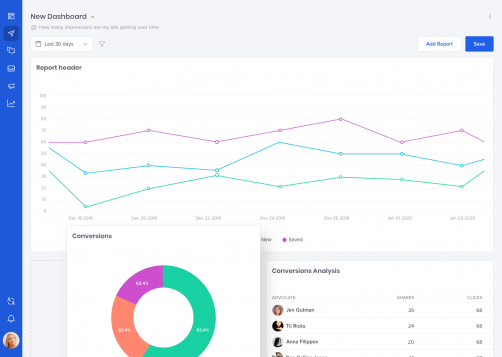
Social BI is already available in your account – you will see a new icon in the sidebar (if you don’t, please contact us). It’s still in open beta for the next few weeks: we’re adding new features and improving existing ones – if you notice something out of place or have any questions, don’t hesitate to get in touch.
We’d also love to hear about your experience with Social BI, so any feedback is welcome.
