The BCG growth matrix in digital marketing

Table of contents
A cow, a dog, a star, and a question mark walk into a bar… Sound familiar? If it does, then there’s a good chance you studied strategic management in academia at some point. Odds are you’ve come across it even if you haven’t.
The Boston Consulting Group’s Growth Share Matrix (BCG-GSM) was once used by half of the Fortune 500 list. These random-sounding animals and objects were the key to the success of some of the largest conglomerates and companies in the 1970s and 80s. Today, the BCG Growth Matrix still holds value and can offer a unique view of your business’ digital marketing strategy.
What is the BCG growth share matrix?
The Boston Consulting Group Growth Share Matrix was introduced in 1968 by Bruce Henderson, the Group’s founder. It was first published in one of the Group’s essays, Perspectives. The matrix’s aim was to help companies decide which markets and products were most worthy of investment.
The matrix does so based on two main factors: market attractiveness and company competitiveness. The matrix expresses these as relative market share and growth rate. So, how does it work?
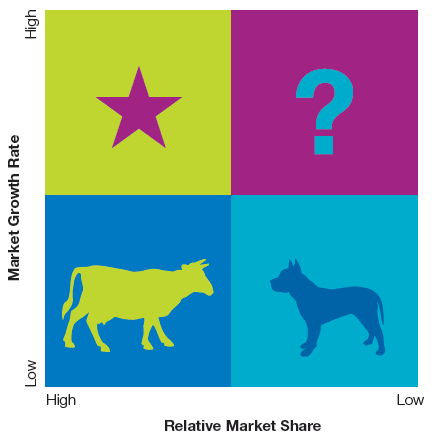
The BCG matrix is broken up into 4 quadrants:
- Dogs
Dogs or “Pets” are products with a low market outlook and low market share. You need to divest from and let go of them, or at the very least minimize your investment in them. Great examples of “dogs” are the Apple iPod and Google’s SketchUp. Both were creative in scope but eventually phased out in favor of other products and projects. - Stars
Stars are the Samsung TV and Gatorade of your digital brand. The flagship products that represent a great deal of investment, but also reward. These products’ relative market share guarantees the highest ROI of any of the quadrants. Yet, that nets out given a market’s rapid growth.This means you need to keep an eye on your Stars to ensure they continue to shine brightly in your bottom-line skies. If they stop, you need to adjust your strategy and tactics to match. Don’t allow your Star to become a Dog by ignoring the results and failing to shift your strategy appropriately. Stars usually have high brand recognition. They have already developed a community of users or customers around them. So just like celebrities, star products are uniquely suited for social media. If you have a Star product and aren’t actively on social media, it is very likely that your customers are already there, talking about you, without you having any visibility into the conversation or ability to control. Social media should be a strategic channel for Stars. - Cash Cows
Cash cows are the products that have matured over time and generate more revenue than the investment they need. They are your current most profitable assets, and you need to “milk” these cows as much as you can for cash. That said, you need to do so without killing them by overmilking. Some examples of Cash Cows are P&G’s Pampers diapers and Pringles snacks. - Question Marks
Question Marks are perhaps the greatest challenge but also the focal point of the GSM. They require the most consideration and carry the most risk. Question Marks are products that hold a low market share, but occupy space in quickly shifting markets. They require high levels of investment to maintain and grow your market share.Apple’s Airpods and Amazon’s Fire Phone are great examples of question marks. They require a great deal of investment, and there is a high level of uncertainty about what the long-term result will be.
The greatest advantage of the BCG growth share matrix over other business management tools is its simplicity. It’s easy to understand, and it’s great for companies to compare their products side by side for a “snapshot” of their business.
The GSM is an extremely useful tool, but it isn’t without its shortcomings. With only four quadrants, companies sometimes find their products straddling the line, making classification less straightforward.
In addition, acquiring accurate and up-to-date market share and growth data can be challenging, especially in small or new markets. Thus, the BCG Growth Share Matrix is a rather inaccurate tool for many.
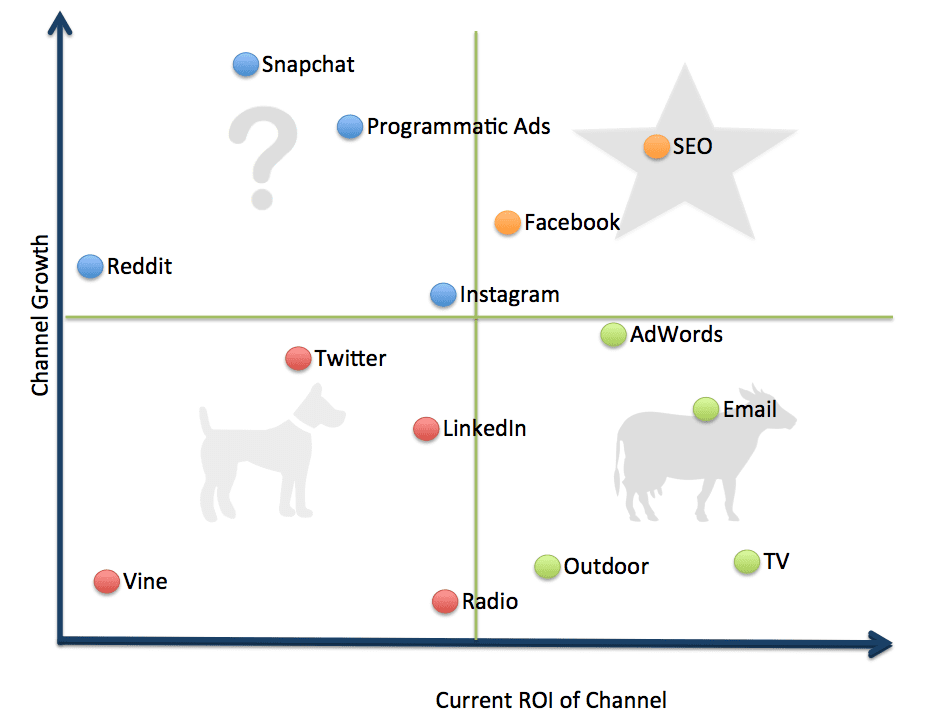
How can the BCG growth share matrix be used in digital marketing?
The BCG-GSM was designed to give companies insights into their products’ performance. However, it can just as easily be applied to analyzing and improving marketing strategy.
In 2020, the matrix has two main uses in digital marketing: to choose marketing tactics and to evaluate them after they’ve been implemented.
Recommended for further reading
Using the BCG growth share matrix to choose marketing tactics
For each quadrant of the matrix, there are strategies and tactics that may yield better results than others.
1. Dogs
Dogs are relatively simple to strategize for. Stay away from media expenditure on dogs. The low profitability and low ceiling make it a waste of effort and money. Markets flooded with generic products (like laptops) face constant competition and substitution. To stand out from the throng is a hard-fought battle.
With such products, companies can use targeted messaging as a key focal point in their strategy. Finding a niche market where the product might flourish could offer it new life. As a result, the product might even shift its place on the Growth Matrix.
2. Stars
Stars are one of your major investments, and they require strong moves with your digital strategy to pay off dividends. In a quadrant that signifies high growth and level of investment, Stars have the potential for a big payoff, but that possibility comes at a high price.
SEO will be the biggest asset for your Stars. When people look for a certain product, Google is their best friend. Organic search results are their way to discover the right product or service. This can help generate more leads for your Stars.
Identifying and using the proper keywords for your campaign will help boost your website’s rankings. Be sure to follow your metrics and determine if some keywords perform better than others. Try to find new ones occasionally to further improve your website ranking and lead generation.
3. Cash cows
It’s time to reap the rewards from your cash cows. These are products that already have high customer awareness. Tools like reminders and a bit of media buying will keep the cash flowing.
Just like Apple reminds customers to upgrade to the next iPhone, you need a gentle “push” to remind your consumers what’s available. Statistically, this upgrade happens every ~2.2 years, so you need to find alternatives to fill the interim, but not break the bank. Social media can be a great tool in this regard.
4. Question Marks
Well-tracked and analyzed PPC advertising can help you determine whether your question mark is piquing customers’ interest.
PPC is so useful here because it drives the most qualified leads. Last year, 65% of all high-intent searches resulted in an ad click, and those individuals were 50% more likely to buy the product.
If the PPC campaign performs well and generates interest, you know it’s worthwhile to try to invest in that Question Mark to help it become a Star. If the opposite occurs, and the campaign weakens, you are most likely looking at a future Dog. You can try other tactics, but for Question Marks, the PPC is a strong litmus test for potential success.
Using the BCG growth share matrix to evaluate digital marketing tactics
The GSM can not only be used to choose digital strategies but to categorize and evaluate those strategies currently in use. For example, strategies like email marketing or search ads that were your cash cows may have turned into Dogs while you weren’t looking. It’s impossible to know without evaluating their place in your digital strategy.
If you employ a very comprehensive digital marketing strategy, you can design a matrix for each aspect of it.
Content Marketing Matrix is an invaluable tool for looking at your assets in terms of content and how they stack up to your competitors. With this matrix, you can map customer intent and product strategy with the various content formats across your assets. This allows you to take a look at where your content sits and where there are holes or opportunities in the future for more.
Content Optimization Matrix is another useful tool to map out your digital brand. It can be used to assess the value of your various sites and apps in terms of leads and sales, and where they fit in your brand. This matrix is designed to give a visual representation of the performance of your content and will help sift through the mass to find what’s worth it, and what isn’t. The key here is to put most of your energies into your top-performing content and creating more evergreen.
Finally, the Content Distribution Matrix allows you to examine different channels you can use for your content and ways to drive traffic to them. This matrix helps examine how effective Paid, Owned, and Earned media are at distributing your content. It can help identify what is a potentially successful medium, and what is best left on the wayside.
Wrapping it all up
Success in digital marketing does not demand the reinvention of the proverbial wheel. Sometimes all it takes is dusting off an old(er) model and adapting it to the digital era.
Though it may have lost some of its shine from the 1970s, the BCG Growth Matrix is still used today. In 2020, it can be much more than a way to evaluate the performance of your business’s products, brands, and services. With a few tweaks and some accurate conversion and ROI data, the BCG-GSM can be an invaluable tool for planning and evaluating your digital marketing strategy and tactics.